Last Updated on December 20, 2023 by Mary Pressler
The History of Smart Meters
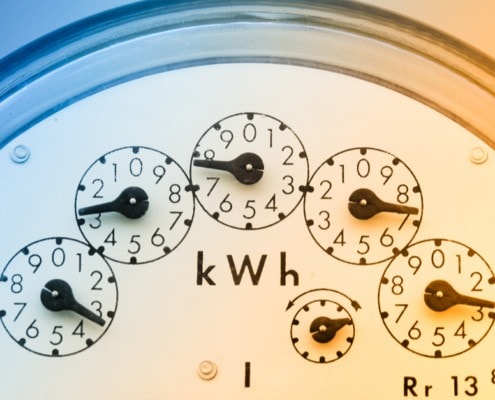
Prior to smart meters, electricity consumption was measured with analog meters, which normally had a spinning disc and dials with numbers. The disc would spin faster when energy usage was high, and slowly when consumption was low. Local utility companies would send a human “meter reader” to record data for every home, and customers were billed accordingly.
The first smart meters were patented in 1974 and launched in 1977. Unlike their analog counterparts, smart meters use electronic measurement and a digital display. Smart meters have faced skepticism, since they give the impression that data can be altered more easily. However, electricity providers and utility companies are subject to stringent laws in the modern power industry, and smart meters offer many benefits when deployed correctly.
Today, most homes in the United States are equipped with a smart meter. However, most consumers don’t know how to access their home’s smart meter data. In this article, we’ll provide you with the tools you need to access your personal energy usage and use it to lower your electricity bill.
Use Your Smart Meter Data to Save Electricity
With a smart meter, you can keep track of electricity consumption just like when you check the balance in a savings account or credit card. By simply monitoring your electricity usage, you can identify your high-consumption hours, and determine which home appliances are causing them. “You can’t control what you can’t measure” is a common phrase among engineers, and this is a good example!
Depending on your electricity plan and how your smart meter is configured, you can also view surplus generation from onsite solar panels, wind turbines, or any renewable energy system you own. Your electricity provider can purchase these kilowatt-hours, and subtract them from your next power bill.
As an example of how smart meter data can help you select a better electricity plan, consider the following scenario:
- Three homes are currently on a “Free Nights” plan, where they are not charged for electricity between 9PM and 9AM, but pay 20 cents/kWh from 9AM to 9PM.
- All three homes consume 1,200 kWh per month, but home #1 uses 800 kWh during paid hours, home #2 uses 600 kWh, and home #3 only uses 400 kWh.
The corresponding electricity bill for each home would be the following:
| Customer | Consumption | Paid Consumption (20¢ / kWh) | Amount Billed |
| Home #1 | 1,200 kWh | 800 kWh | $160 |
| Home #2 | 1,200 kWh | 600 kWh | $120 |
| Home #3 | 1,200 kWh | 400 kWh | $80 |
Since a smart meter registers data at 15-minute intervals, consumers can see how their electricity usage is distributed during the day. When we receive a power bill, we often focus on the totals – kWh consumption and amount billed.
However, the three homeowners in this example could check their smart meter data, and see how consumption is split between the two schedules (9PM-9AM and 9AM-9PM). This is possible, since the measured data includes consumption at 15-minute intervals.
- If another electricity plan offers a fixed rate of 10 cents/kWh, regardless of the hour, all three homeowners would be billed $120.
- Home #1 would save $40 per month by switching, home #2 would get the same bill, and home #3 would actually pay $40 more per month.
Reducing your power bills by switching your electricity plan is possible, but you need data to make a good decision. The measurements collected by smart meters are useful when trying to decide which plan works best for you.
Learning how to read an Electricity Facts Label (EFL) is also important, so you can know exactly how your electricity will be billed. Some plans offer you low rates, but only if you meet certain conditions that are not evident upfront. For example, there may be a discount for exceeding a certain kWh consumption, but you pay much more if you don’t reach that value.

